This is the February blog of our 12-month series on deep dives into BRIDGE 2.0. Check out our year end blogs on what we learned and actions organizations can take to advance equity and inclusion, and our January blog on how to make change stick. Benchmarking Race, Inclusion, and Diversity in Global Engagement (BRIDGE) is an institutional survey that assesses the state of diversity, equity, and inclusion in the global development sector. Read the full report: BRIDGE 2.0 report.
I have worked in international development and humanitarian assistance for over a quarter of a century. From my vantage point, not enough has changed in Black, Indigenous and people of color (BIPOC) representation. Results of the 2023 Benchmarking Race, Inclusion, and Diversity in Global Engagement (BRIDGE) survey support this viewpoint. The survey shows that most staff (60%) are white and that white staff are overrepresented at leadership (71%) and Board (65%) levels compared to the general population. There are only minor increases (2-3 points) in BIPOC representation between the 2021 survey results and 2023.
What we know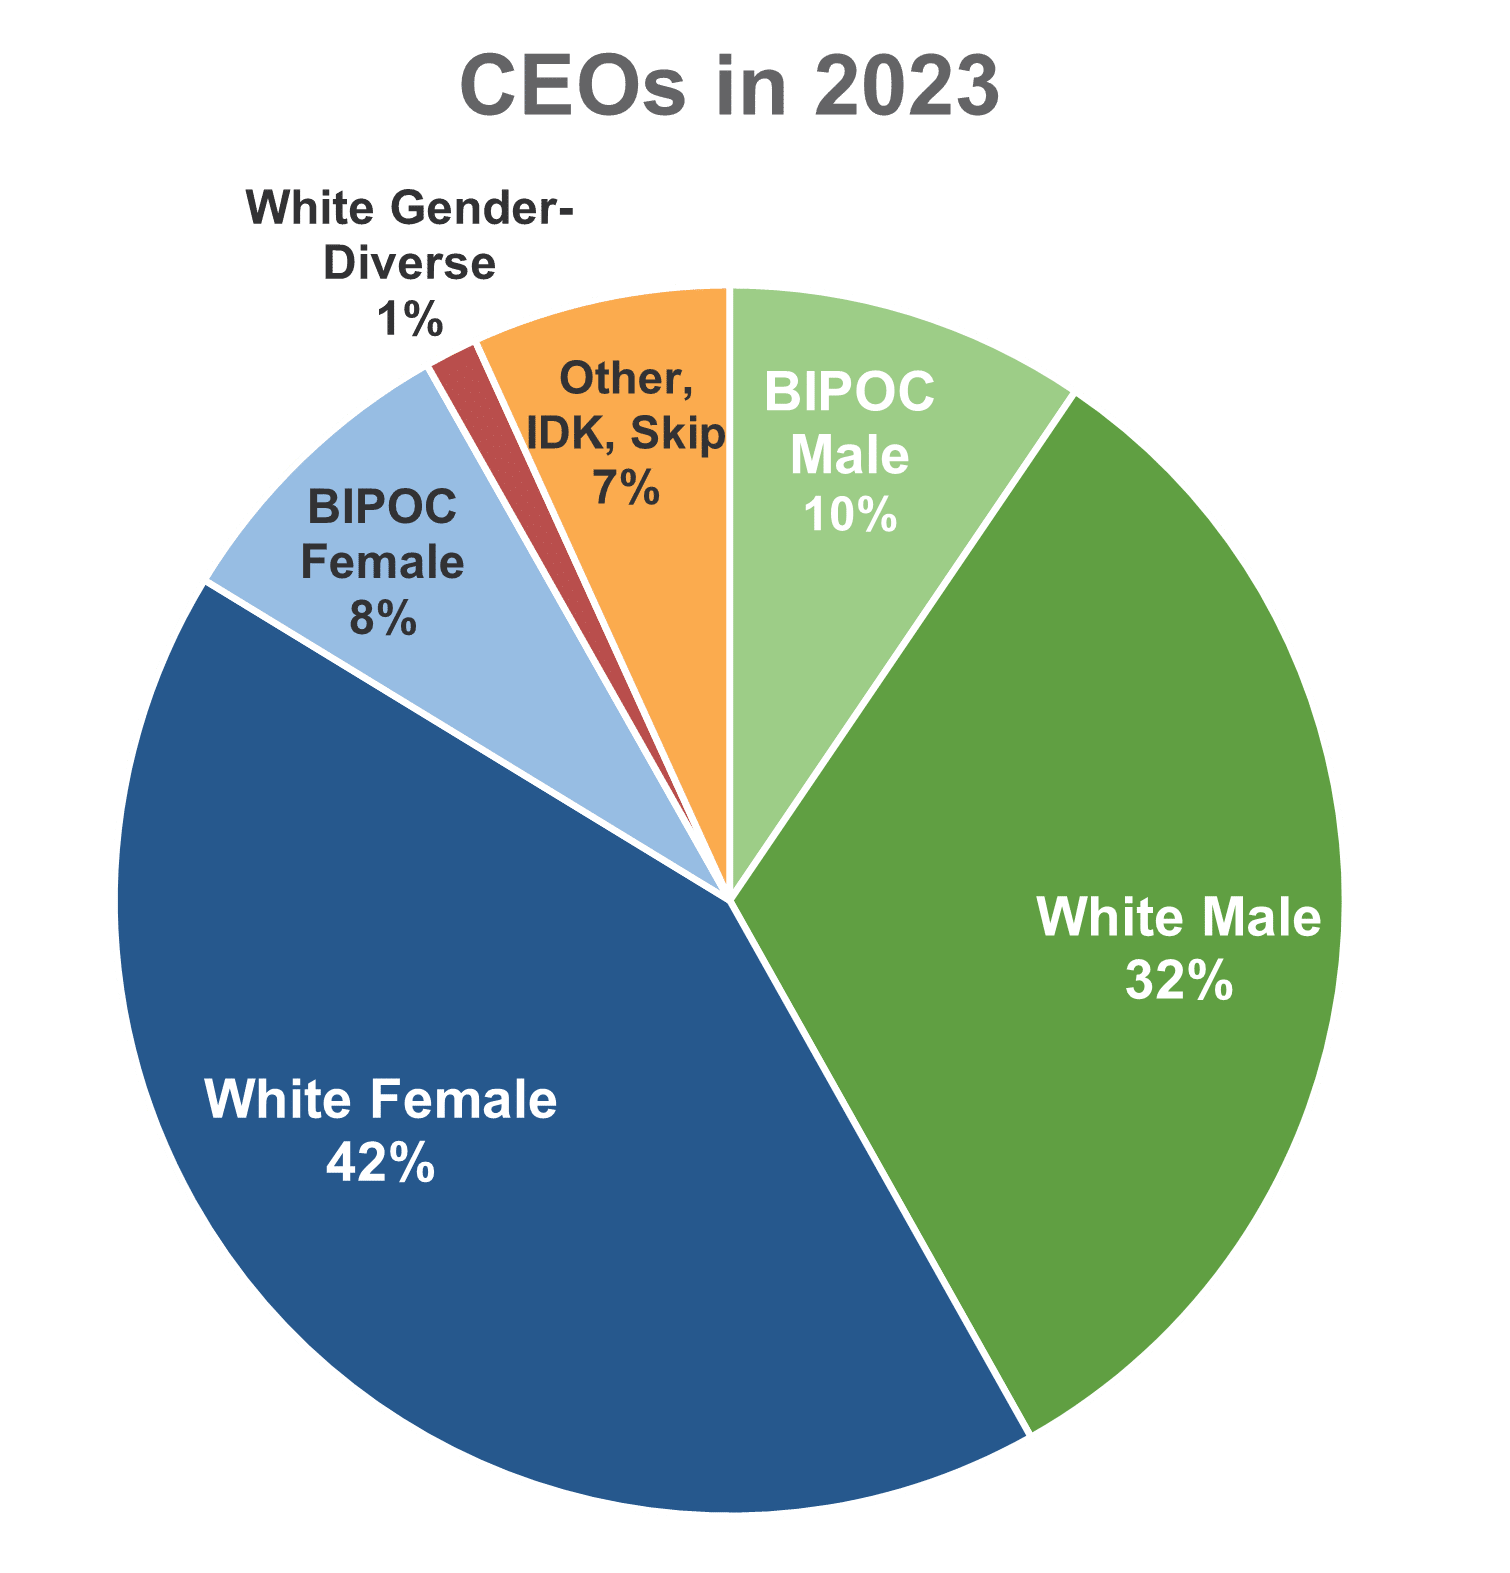
Here’s what we know from the 2023 BRIDGE survey about BIPOC representation in international development and humanitarian assistance organizations. BIPOC individuals make up 40% of staff and are mostly found among the rank and file. A third of BIPOC individuals (29%) are in leadership, 18% are CEOs and 35% are board members. While these aggregate numbers look good when the numbers are disaggregated, differing patterns for BIPOC groups paint a different picture.
When compared to their percentages in the US population, Black representation (13% in the population) matches their proportion of staff positions but is 2% percent lower for leadership positions and 2% higher for board positions. Asian Americans exceed their proportion in the population (6%), with 11% in staff positions and 8% and 7% respectively for leadership and board positions. Latinx/Hispanics have the widest gap in positions at all levels when compared to their proportion (19%) in the general population. They only hold 10% of staff positions, 6% of leadership positions, and 5% of board positions. Multi-racial people who make up 3% of the general population make up 4% of staff but only about half of their proportion in the population for leadership (2%) and board (1%) positions. Native American/Alaskan Natives who make up 1% of the general population only constitute about half of that proportion in staff (0.5%), leadership (0.4%), and board (0.4%) positions. Pacific Islanders who make up 2% of the general population are half (1%) of their general population proportion of staff positions, have zero representatives in leadership, and 2% in board positions. The survey also found that BIPOC CEOs, especially female BIPOC, are still under-represented. While white females make up the largest proportion of CEOs (42%), BIPOC CEOs are a much smaller proportion at 10% for males and 8% for females. Further, the survey found that 19% of leadership teams had no BIPOC members at all.
In addition to the differing patterns of representation for BIPOC staff uncovered through the BRIDGE survey, a key finding is the proportion of BIPOC individuals recruited in the two years before 2023. Survey results indicate that 36% of new staff hires were BIPOC. In and of itself, this looks good, however, the survey also indicates that 29% of staff departures were BIPOC. By this count, that leaves an industry net growth of 7% BIPOC staff.
In terms of non-profit compared to for-profit organizations, there is evidence that non-profits had slight but consistent improvement in overall BIPOC representation between 2020 and 2023. However, this trend is unclear among for-profit organizations. However, for-profit organizations are more likely to have BIPOC CEOs, in both 2020 and 2021 compared to non-profits.
What we don’t know
Even with the BRIDGE survey’s much-needed data, there is still a lot that we do not know. Every organization is different, and we do not know the unique contextual factors for different organizations that combine to form the patterns found (i.e., religious versus secular, large versus small). Less is known about the organizational systems and processes for recruitment, retention, and promotion or the enabling and disabling factors that contour the results of these processes. We do not know why some BIPOC groups have higher representation numbers than others or why BIPOC staff depart. I suspect the answers to these questions have a lot to do with organizational culture and the extent to which organizational leadership embraces and commits to racial and ethnic equity, diversity, inclusion, and belonging as well as the extent to which this embrace and commitment is institutionalized in systems and processes that are accountable.
What we can do
The BRIDGE survey results on BIPOC representation in our industry do not tell us what to do about the uncovered patterns of overrepresentation and underrepresentation or the fact that much has not yet changed. Instead, the survey results are a benchmark for organizations to compare their patterns and results and to go deeper and uncover their unique “why”.
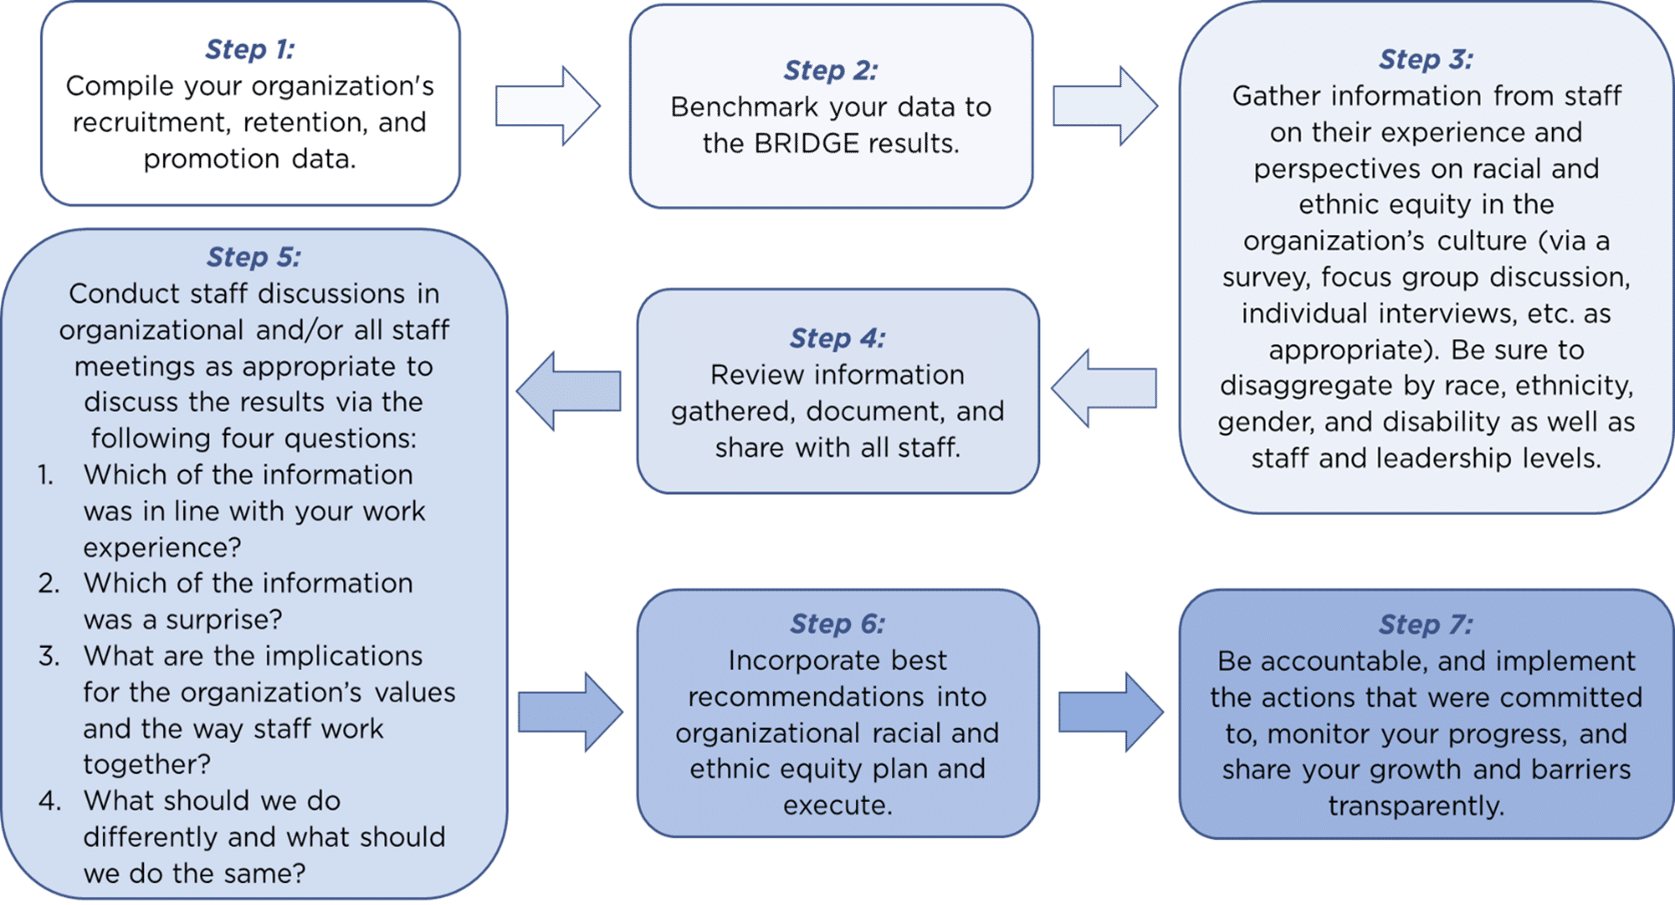
The following are steps that can be taken by your organization’s Diversity Officer, CEO, Human Resources, Diversity Council, or a diversity consultant to uncover your organization’s unique “why” and inform a way forward:
A quarter of a century is a long time to wait to see progress in BIPOC representation, particularly in an industry whose mission is to change the world by doing good. BIPOC staff have much to offer to this mission of changing the world and organizations that welcome and nurture their contributions and advance their leadership will see effective outcomes. I believe that if there is an industry that can get racial and ethnic equity right, it is the international development and humanitarian assistance community. Let the 2023 BRIDGE results be your organization’s catalyst for organizational change.
______
Patricia T, Morris, Ph.D., President Equilo Foundation and Member, CREED Board of Directors. Advisory Council member for BRIDGE 2.0, Dr. Morris is a gender, diversity, and social inclusion expert with more than two decades of professional experience working with international relief and development organizations, global advocacy coalitions, international contracting firms, and higher education institutions. During her 25-year career, Dr. Morris has led dozens of organizations and corporations in institutionalizing gender and diversity policies, advancing women’s and girls’ empowerment, and promoting social inclusion, women’s rights, and gender equality in their policies and programs. Her areas of expertise include gender integration, gender audits, GESI analysis and assessments, diversity, equity, inclusion, and belonging initiatives, women’s economic empowerment, and gender in peace, conflict, and security.