Benchmarking Race, Inclusion, and Diversity in Global Engagement (BRIDGE) is an institutional survey that assesses the state of diversity, equity, and inclusion (DEI) in the global development sector. In 2021, the inaugural survey established the first ever DEI benchmark for the development and humanitarian assistance sector. Two years later, the follow-on survey, BRIDGE 2.0 explores the same questions and dives deeper to better understand organizations’ experiences and challenges. By gathering this data and making it publicly available, BRIDGE makes DEI issues more visible and helps individuals, organizations and the sector make evidence-based shifts to increase diversity, be more equitable, and practice inclusion.
Read the full report here: BRIDGE 2.0 report. 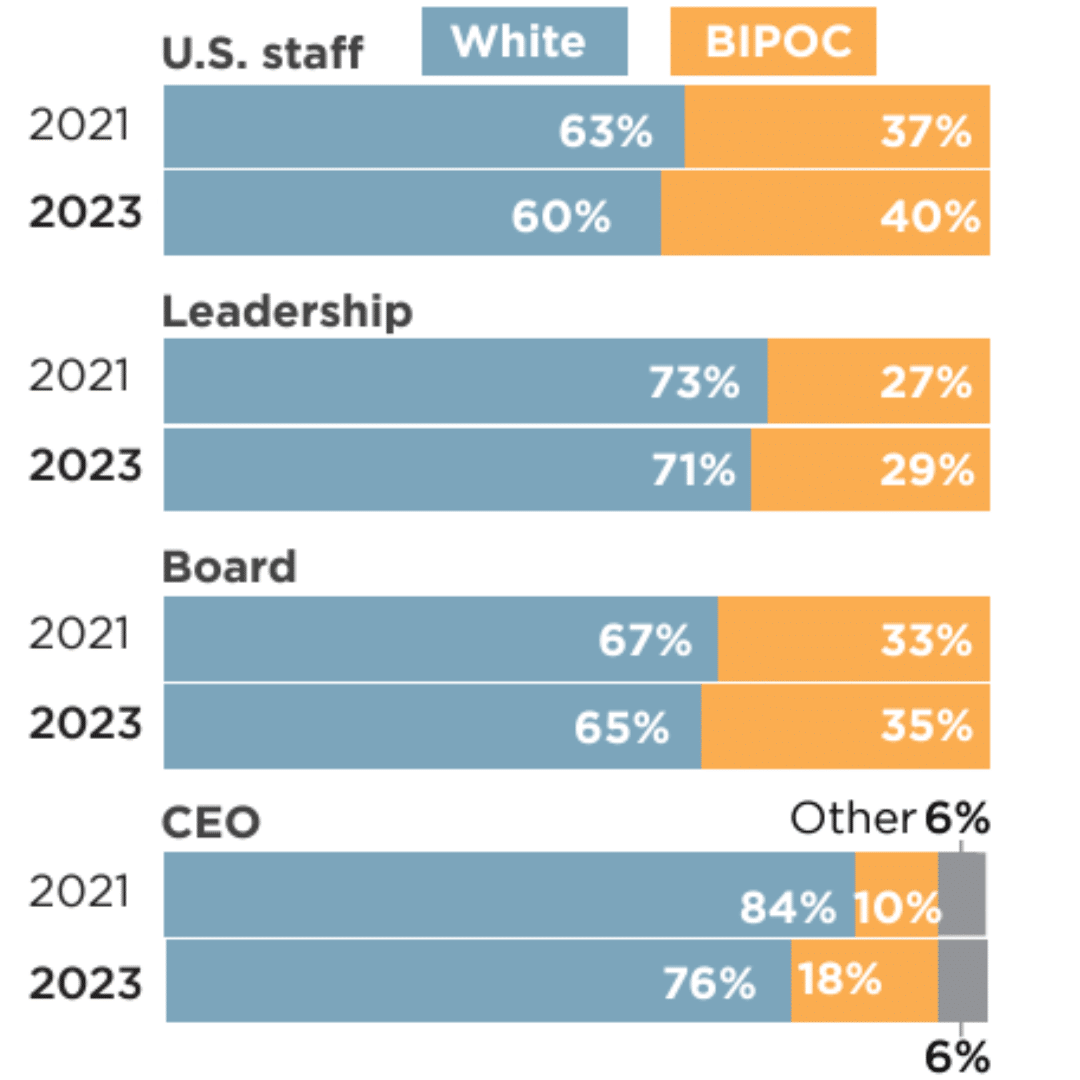
What have we learned from BRIDGE 2.0?
1. Racial and ethnic minorities remain under-represented in positions of power.
While overall staff levels racially represent the US population based on the 2020 census, leadership does not. Black, Indigenous, People of Color (BIPOC) representation was essentially unchanged from 2021 to 2023 at the leadership team level and the board level. Though our findings suggest that the share of BIPOC CEOs increased since 2021, the fact that the absolute number of BIPOC Chief Executive Officers (CEOs) did not change leaves us less confident in this increase. Particularly concerning is that the racial composition of leadership teams did not shift and that 1/5 of leadership teams remain exclusively white. Leadership teams often produce CEOs from within their cohort after helping individuals to develop their skills and advance, thus, the latter finding does not bode well for seeing more diverse representation at the CEO level in the future.
2. The global development sector remains predominantly white and female, including at the top.
Women make up the majority of the sector and are 53 percent of CEOs, based on the 2023 data. This is a proud achievement compared to Fortune 500 companies, which had only 11 percent female CEOs in 2023. Despite the success, we must consider the importance of intersectionality—the combination of our multiple identities. In 2023, only eight percent of female CEOs were BIPOC, while BIPOC females account for over 20 percent of the US population. We also positively found improvement in how organizations captured gender data— with more organizations providing non-binary gender categories. Three percent of CEOs reported being gender diverse in 2023, which was a category that was not selected in the 2021 survey.
3. Disability reporting shows signs of greater awareness.
We saw little to no change in disability status data that were reported in BRIDGE 2.0 compared to the 1.0 survey. The biggest change was at the board level where there was a significant increase in “I don’t know” responses in 2023. This finding suggested greater awareness among organizations that disability may not be physical or visible. Since many organizations likely do not collect self-reported demographic information from their board, survey respondents, now with greater awareness about disability, chose the “I don’t know” response rather than making an independent determination about board members’ disability status.
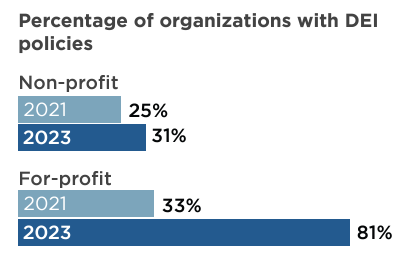
4. Organizations have invested in establishing governance structures for DEI.
Organizations show great improvement in their DEI governance structures. Eighty-one percent of private sector organizations have a DEI policy. Eighty-three percent of all organizations have human resource-led DEI initiatives, and half have DEI internal focal points and a DEI council. Sixty-two percent of organizations embedded DEI goals into their organizational strategy and 48 percent updated their corporate values to incorporate DEI. These developments are significant because they indicate sustainable organization-level foundation building for future progress for more diverse staff, more inclusive practices, and eventually culture shifts.
5. There are modest improvements in how diversity data are captured.
Organizations are improving how they capture data. Thirty-three percent of organizations changed their demographic categories to be more inclusive. Improvements not only included more options, but also, more inclusive practices such as defining terms, offering the selection of pronouns, and offering write-in options.
6. Commitment to DEI remains, but competing priorities and resource limitations are a severe impediment to progress.
As a sector, we are committed to DEI efforts, but organizations deprioritize these efforts over other critical needs. Our findings are consistent with the 2023 CEO Insights on NGO Futures Report by InterAction, which shows a steady decline in CEO’s prioritization ranking of DEI, from second in 2021 to sixth in 2023. Despite the decline, 78 percent of CEOs agreed that DEI is a priority. This deprioritization of DEI is driven by the constant addition of new priorities which must be addressed via a finite set of resources. These resource constraints are especially pronounced in the global development community when trying to figure out what DEI looks like in a global, multi-cultural operating environment. Based on the survey responses, organizations face so many unknowns in engaging in the global DEI space that they become stuck in the planning and scoping stage, unable to move to implementation.
7. There are tensions between global DEI, localization, and domestic DEI that need to be resolved—but also, many points of similarity.
Organizations reported they are struggling with understanding where DEI ends and localization begins, which manifests in the search for answers to practical but critical questions. How do you have pay and benefits equity in a global organization? How do you factor in local power dynamics? How do you operate in countries with legal and cultural barriers counter to your organization’s DEI principles?
Conceptually, DEI and localization have many of the same objectives: shifting power, increasing equity, and promoting inclusion. However, operationally, DEI and localization are often separated due to earmarked budgets, organizational structures, and staffing needs. Given the similarities between the two, as well as the absence of a universal understanding of how these terms are operationally integrated leads to confusion, unhelpful siloing, or implementation paralysis.
Where do we go from here? Our conclusions are only the starting point to ground our actions in evidence. Check back here soon for our blog on our call to action at the sectoral and organizational level, or read more now in our full BRIDGE 2.0 report here.
______
Authors:
Shiro Gnanaselvam is the President and CEO of Social Impact. With over 30 years of international development experience in program, operational and leadership roles, she has been a passionate advocate for using evidence and learning to make social programs more effective. Shiro is a board member of the Coalition for Racial & Ethnic Equity in Development (CREED) and the Professional Services Council where she co-chairs the DEI Working Group for the Council of International Development Companies.
Brooke Hill co-leads Social Impact’s Equity Incubator a learn-do initiative that works at the intersection of data, learning, equity, and inclusion. She serves as the technical lead of BRIDGE and Project Director of the Managing Agency Priorities mechanism which supports equity, inclusion, and organizational development within USAID. She is a Senior Program Manager in SI’s Strategy, Performance, and Learning division.
Mateusz Pucilowski is the Vice President of SI’s Evaluation, Research, and Analytics division. He is the Project Director of BRIDGE and led survey design and data quality oversight.